Where are the most Democratic and Republican neighborhoods in the Bay Area?
Rich neighborhood, poor neighborhood
Thanks for joining me for the 23rd issue of the Golden Stats Warrior, a newsletter for data-based insights about the Bay Area. If this is your first time reading, welcome! You can sign up here. I am grateful for your support. If you are new, maybe check out a story from the archives, like this fun one about Bay Area slang.
Election day is coming! If you live in San Francisco, there is an extremely good chance you will vote against Donald Trump.
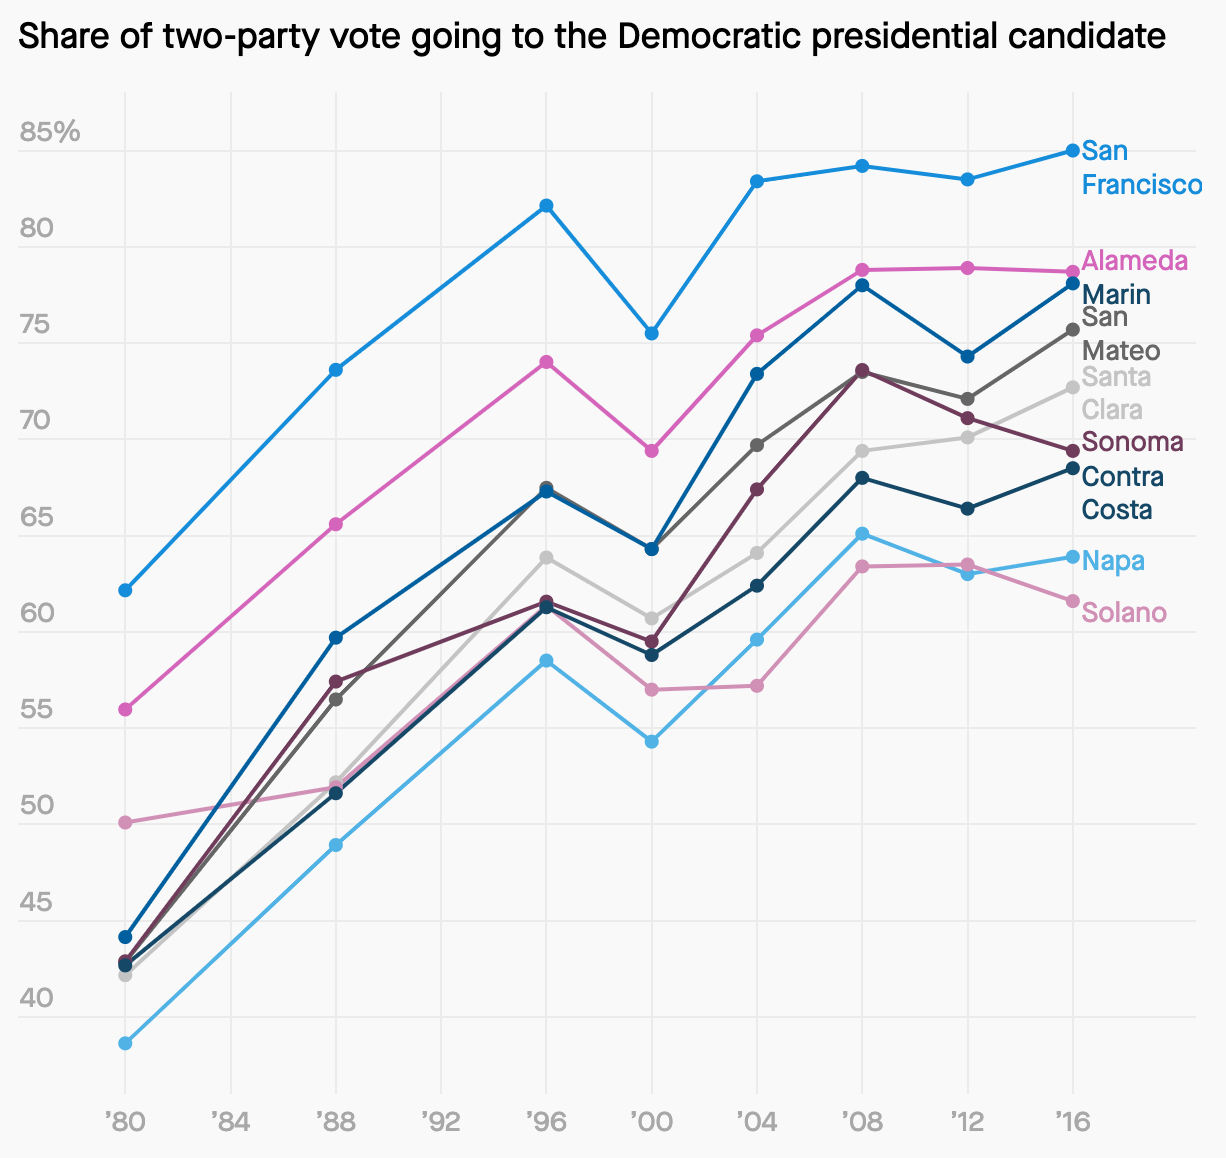
In 2016, 85% of San Franciscans who voted for one of the two major party candidates voted for Hillary Clinton. Out of the 1,032 US counties with over 20,000 voters, San Francisco had the fifth highest share of people going for Clinton, just after the District of Columbia, the Bronx in New York, Prince Georges County in Maryland, and Manhattan.
This won’t come as a shock to readers, but even beyond SF, the Bay Area is a bastion of blue. Alameda County (79%) was 15th on this list, and Marin was just behind it (78%). Even in Solano and Napa Counties, the most Trump supporting counties in the Bay, more than 60% of voters went for Clinton.
Yet it wasn’t so long ago that the Bay Area was competitive. In 1980, Ronald Reagan actually won six of the nine counties in the Bay Area, even getting more than 60% of the vote in Napa.

What’s happened to the Bay Area is a microcosm of the US.
As the Bay Area diversified—going from 70% white in 1980 to 40% in 2017—the number of Republican voters declined. The region also became more highly-educated, another indicator of turning blue. In contrast, the Republican party is increasingly the party of white, religious people who don’t live in cities, and the Bay Area just doesn’t have too many of them. Notably, relatively rural and white Solano and Sonoma counties are actually recently trending more Republican.
So inside the Bay Area, where are the most Democratic and Republican enclaves?
The best way to understand that is by looking at voting returns by precinct. In an incredible feat of data collection, Washington State University doctoral student Ryne Rohla put together precinct level data from all across the US for the 2016 presidential election. The New York Times then beautifully mapped that data. You can see a screenshot map below (I suggest clicking on the link and interacting with the map). The “You” on this map indicates where I live—so now you know 😊.

If you zoom in on San Francisco and Oakland you can see that the city centers are dark blue (more Democratic), while the richer residential areas are a bit lighter.

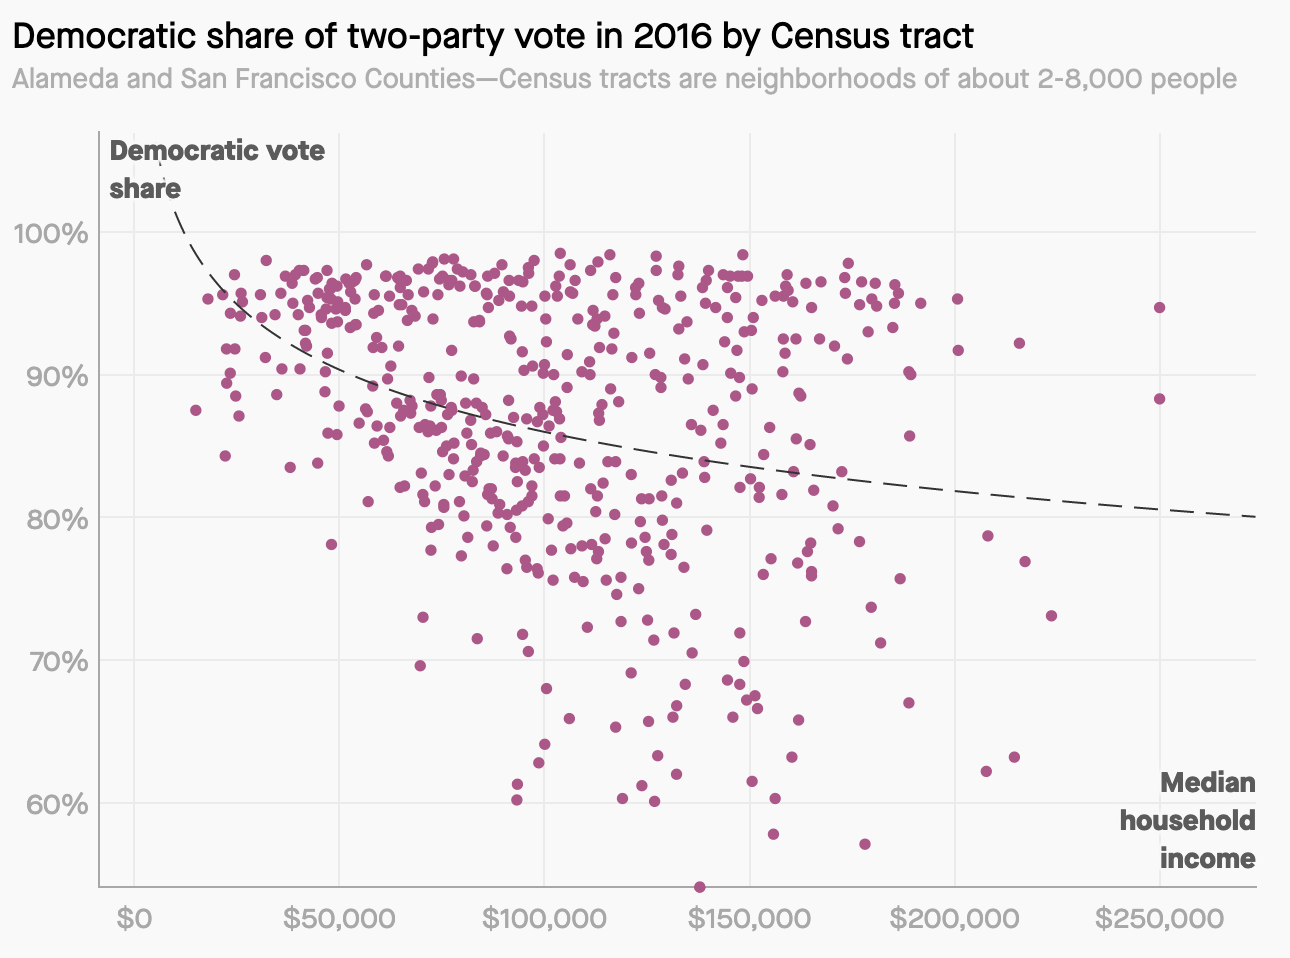
This points to an important point about Bay Area politics. Higher incomes are negatively associated with the liberalness of a neighborhood.
As Democrats have become the dominant party of rich areas of the country like the Bay, a common fallacy has arisen that the Democrats are the party of the rich, elite. The reality, as I wrote about in Quartz this week, is that Republicans remain the party of the rich.
Red State, Blue State, Rich State, Poor State: Why Americans Vote the Way They Do, by the Columbia University statistician Andrew Gelman, is one of my favorite books on modern US politics. In the book, Gelman examines the paradox that while the richest states and cities go for Democrats, poorer Americans are still more likely to vote for Democrats and richer ones for Republicans. In the 2018 midterms, for example, 59% of people in households with less than $50,000 voted for Democrats. The majority of people in households making over $100,000 went for Republicans.
Gelman found the answer to the paradox by zoomig in. Though the richest states vote for Democrats, within those places, the rich are more likely to vote for Republicans than Democrats. It is not the rich in the richest places that make them so Democratic, but their middle and lower income workers.
This is also true in the Bay Area.
To analyze the relationship between income and partisanship, I took data on voting by census tract in San Francisco and Alameda Counties, and combined it with the median incomes in these tracts from 2014 to 2018 (census tract are neighborhoods of about 2,000-8,000 people). In the typical census tract where household incomes are below $50,000, well over 90% of the people voted for Clinton. In areas where people make over $200,000, the average is closer to 80%. Still incredibly high, of course, but significantly lower.

Of course, all of this is also related to race. Of the 131 census tracts in the two counties where 95% of the voters went for Clinton, less than half were majority white non-Hispanic. Of the 35 tracts where more than 30% voted for Trump, 31 were majority white. (I suggest reading this terrific Oaklandside piece for more historical context on these racial dynamics.)
Final note: If you were curious, I tried to find the precinct in the Bay Area that had the least support for Donald Trump, and it appears to be an area in South Berkeley where just three out of 336 voters went for our current president.
Bay Area media recommendations of the week
As Californians, we live in a world shaped by Prop. 13. The 1978 law capped property taxes at 1% of a property’s assessed value, and freezes that value to the time of assessed value at time of purchase. As Ben Christopher writes in CalMatters, the law has a huge impact on local government’s ability to generate revenue. It also incentivizes communities to build commercial real estate, rather than residential, worsening our housing crisis. Christopher explains how this year’s props 15 and 19 attempt to make changes to the influential law.
Prop. 13 isn’t all bad. There are low-income people that have been able to stay in their home, even as its value skyrocketed, because of the Prop. But the problem is that law is poorly targeted. Too many rich people also benefit, and it would be better to only give a tax break to those who can’t afford paying more.
For more on how Prop. 13 subsidizes the wealthy, check out Phil Levin’s Tax Fairness Project. Levin put together an amazing map with data on over 750,000 homes showing how much less homeowners pay in property taxes than they would if they were assessed at their current value. It clearly shows that the law most benefits people living in the wealthiest parts of the Bay Area. (Hat tip to Daniel Wolfe)
(If you read or listened to something great about the Bay Area this week, please send it to me!)
Dan’s favorite things
As far as I am concerned, Omnivore Books is the coolest bookstore in the Bay Area. Located in San Francisco’s Noe Valley, the enchanting shop has an incredible variety of literature about food. Name your interest, whether it be mushrooms, Cambodian food, or Bay Area culinary history, and there is a section for that. You get the feeling that owner Celia Sack has read every book in the store, and can offer an impassioned recommendation on just about any subject.
Before Covid, the store also offered great free talks, and will hopefully do so again. One of the best events I’ve been to in the Bay Area was a presentation on the history of punch by the alcohol historian David Wondrich. It is a special store that is definitely worth supporting.
Thanks for your time, and see you in a couple weeks.
If you think a friend might enjoy this newsletter, please forward it along. You can follow me on Twitter at @dkopf or email me at dan.kopf@gmail.com. The Golden Stats Warrior logo was made by the great Jared Joiner, the best friend a newsletter writer could have. Follow him @jnjoiner. Also, thanks to tough cookie Kanchan Gautam for copy editing this week.


