How much worse is the Bay Area air getting?
A lucky history, but perhaps a dark future
Thanks for joining me for the 22nd issue of the Golden Stats Warrior, a newsletter for data-based insights about the Bay Area. If this is your first time reading, welcome! If you haven’t signed up yet, you can do that here. I am grateful for your support.
Lately, as anyone living in the Bay Area knows, the air has been bad. Forest fires raging across the state caused Bay Area air to reach dangerous levels over the last month, even turning the sky orange. Four million acres of California have been burned this year, the most on record. Climate change, unwise forest management practices and housing policy that incentivized people to live in unsafe areas have all contributed to the crisis. It’s part of a dangerous, and unprecedented trend.
It wasn’t always like this. Historically, the Bay Area was a bastion of clean air.
Josh Apte, a Berkeley professor who studies air pollution, explained to me that the region is relatively blessed for three main reasons. One, due to wind patterns moving east, pristine air blows into San Francisco from the Pacific, rather than the polluted air from other parts of the US that goes into some cities in the Midwest and Northeast. Two, the region is less dense than other cities of its size because of the Bay sitting right in the middle—this means less pollution concentration. Three, California has stronger emissions regulations than most of the US. As a result, the Bay had some of the US’s best air quality for a large metropolitan area—though other cities have been catching up.
Quick methodology note: I will be using particulate matter 2.5 (PM2.5) to measure air pollution throughout this article rather than the more commonly used Air Quality Index (AQI). PM2.5, inhalable particles with a diameter of 2.5 micrometers or smaller, causes the vast majority of deaths and disease from pollution. PM2.5 is emitted from fires and cars, among other sources. AQI is a misleading, and strangely calculated statistic that society would probably be better off moving away from.

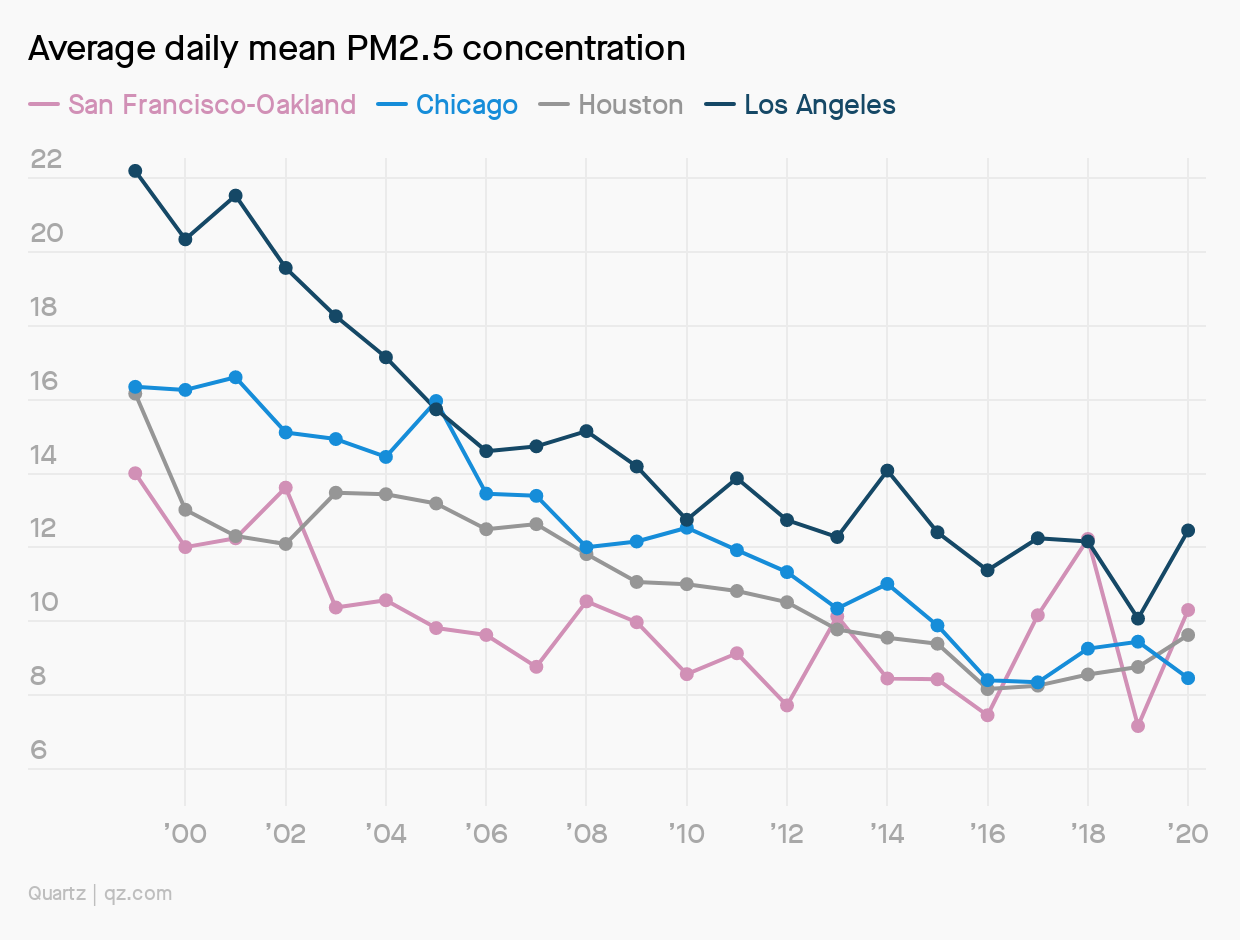
In the chart above, we can see that daily average PM2.5 concentrations in 2017, 2018, and 2020 were all higher than any other year in the 2010s. They even surpassed average PM2.5 in the Houston and Chicago metro areas, regions that used to have much higher levels of air pollution.
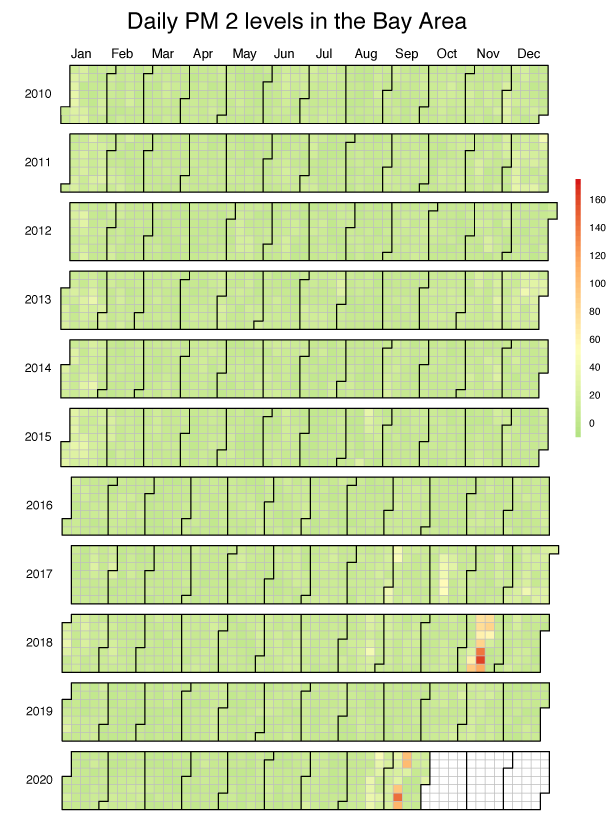
The Bay’s declining air quality is almost entirely due to the increasing number of days with extremely high air pollution from fires. From 2008 to 2016, there were no days when PM2.5 concentrations surpassed 50 micrograms per cubic meter—an extremely high level of particulate matter. In 2018, there were twelve days above this threshold, and in 2020, there have already been five.

And it really is all about the extreme days. On the typical day, pollution in the Bay continues to go down. The median day of air pollution was actually lower in 2019 than any year since the government started collecting PM2.5 data (see the chart below). It’s just the average, driven by the extremes, that is going up.

So how big a deal is having just a few bad days? Very meaningful. Pollution kills.
First of all, days of very high pollution are particularly deadly for elderly people with a comorbidity. A study out of Stanford University found that well over a thousand people died between August 1st and September 10th this year that wouldn’t have without the elevated pollution levels, most of whom were over 65. These people probably would have died relatively soon after even without the fires, but the fires sped things up.
Even worse from Apte’s perspective are the long-term effects of chronic air pollution. While a few bad days hurts, the problem is when they start to accrue. The important pollution number for most people is the average amount, not the median. The fact that typical day is getting better isn’t good enough if the average is increasing. It’s the total amount of particulate matter we take in our lives that leads to lung cancer and cardiovascular issues that dramatically cut people’s lives short.
There are still more ways for the Bay Area to lower emissions, like even stricter industrial and car emission standards, but making sure fewer wildfires burn out of control is key. For more on what experts believe we should be doing to control the fires, read this excellent KQED interview.
And one last visual. Here is are the PM2.5 levels for every single day this decade in one chart.

Bay Area media recommendations of the week
Speaking of air quality, I strongly recommend you listen to the episode of the podcast Containers focused on the story of community organizer and air quality advocate Ms. Margaret Gordon. A resident of West Oakland, Gordon saw the health damage caused to her neighbors by toxic diesel particulates released by trucks transporting goods to the city’s port near where she lived. Since the 1990s, Gordon has successfully fought for laws to improve the air in West Oakland. She is a true Bay Area hero. (Also check out this story about her from KQED.)
(If you read or listened to something great about the Bay Area this week, please send it to me!)
Dan’s favorite things
Perhaps the best place in all of the Bay Area to sunset watch is the Berkeley Rose Garden. The picture below can’t quite do it justice, but I promise there is not much quite like looking down at the Bay from this East Bay gem nestled in the Berkeley Hills. Built in the 1930s, and partially funded by the Works Progress Administration (WPA). Shaped like an amphitheater, the Rose Garden’s terraces and view of the Golden Gate Bridge offer a romantic flair that is perfect for a first date.

Thanks for your time, and see you in a couple weeks.
If you think a friend might enjoy this newsletter, please forward it along. You can follow me on Twitter at @dkopf or email me at dan.kopf@gmail.com
The Golden Stats Warrior logo was made by the great Jared Joiner, the best friend a newsletter writer could have. Follow him @jnjoiner. Also, thanks to LA’s greatest Nina Brooks for copy editing this week.
